Prerequisites: The build has to be done with a debug configuration. A release configuration will optimize the pdb-files and you won't be able to follow the state of the code when debugging. In my case, the command that triggers the build script in Jenkins accepts a parameter for which configuration to use. This sets the configuration switch for MS Build to the desired configuration, like so: /p:Configuration={wantedconfiguration}.
So in steps, to get up and running with remote debugging:
1. Log in to the remote server where your app is running.
2. Download the correct version of Microsoft's Remote Debugger Tool from here.
3. Install it on the server. To do this, you have to have admin rights on the server since the installer makes the changes needed in the firewall to open the port used by the tool.
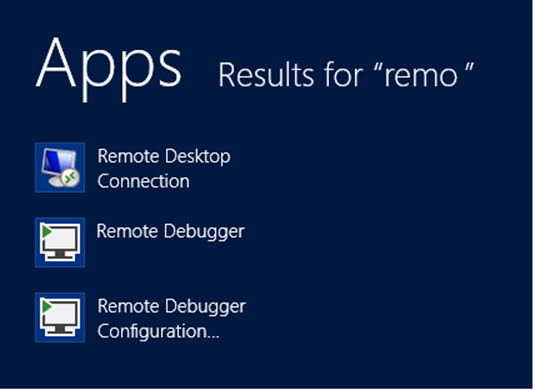
4. When the install is done, you'll find two new apps on the server, the Remote Debugger and Remote Debugger Configuration. The Configuration can be changed to run the debugger as a service or to change the settings in the firewall. Usually, the default configuration works just fine.
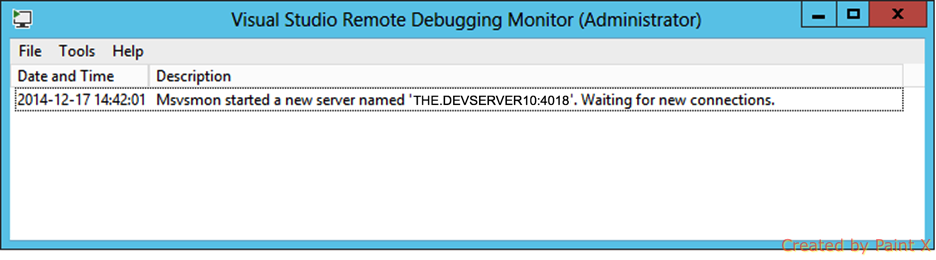
5. Start the Remote Debugger. And, this is important, you have to run it as an administrator. You'll see which URL the debugger is listening at. Copy that URL. You can change settings here too, if you want to allow anonymous access or whatnot, but default settings works fine here as well.
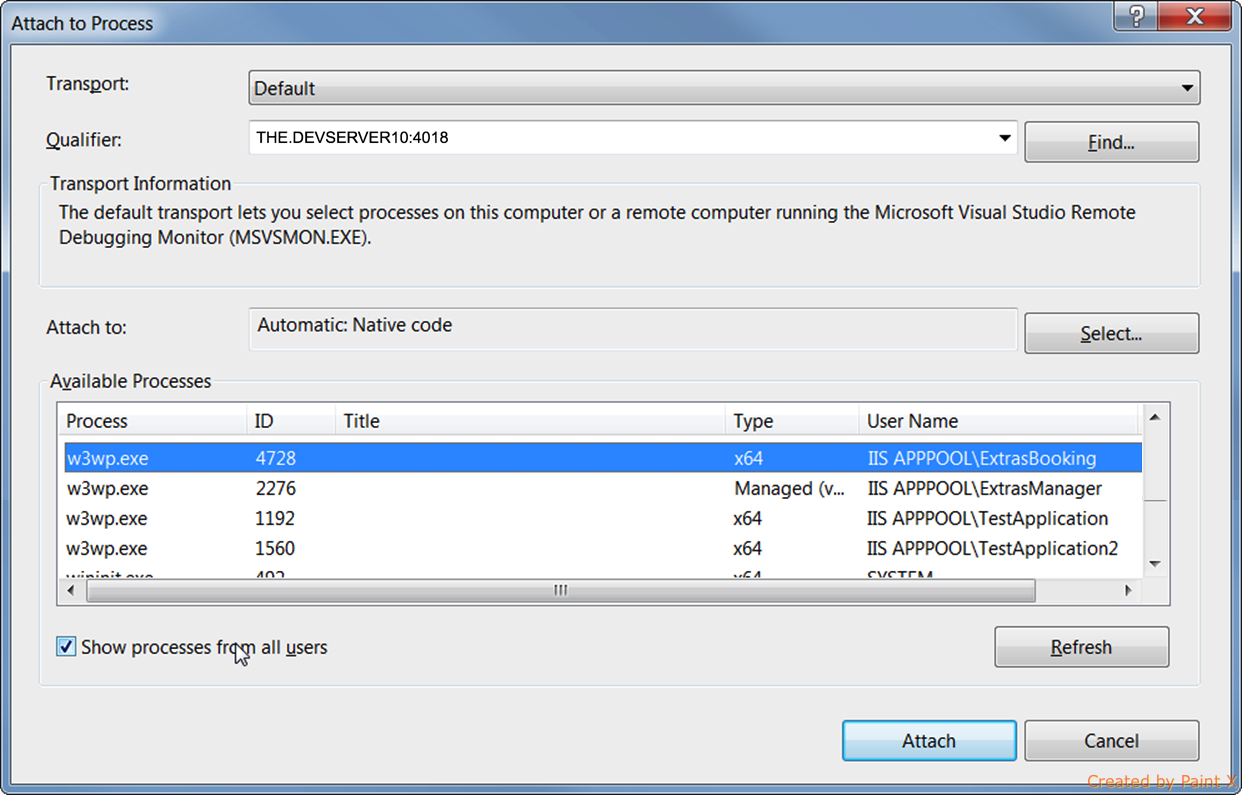
6. Go back to your own local desktop and open the solution you want to debug. In the menu, choose Debug >> Attach to process. In the Qualifier field, paste the URL you copied from the Remote Debugger. This should bring up a list of the processes currently running on that server. Make sure the checkbox 'Show processes for all users' is ticked. Find the process you want to debug and click 'Attach'. IIS sites are running as w3wp.exe processes with the app pool name showing under 'User name'.
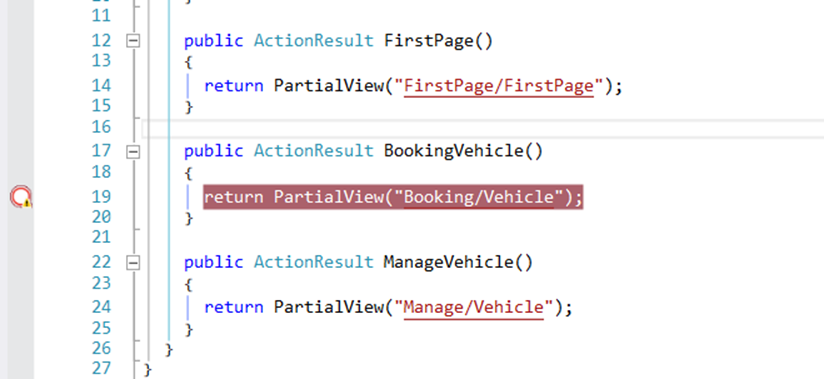
7. Now you can set a breakpoint in your code, but you see that it's not active. Mousing over it shows 'No symbols could be loaded'. What is needed are the symbol files, or the pdb files from the remote server. They have to be available locally on the same machine as Visual Studio.
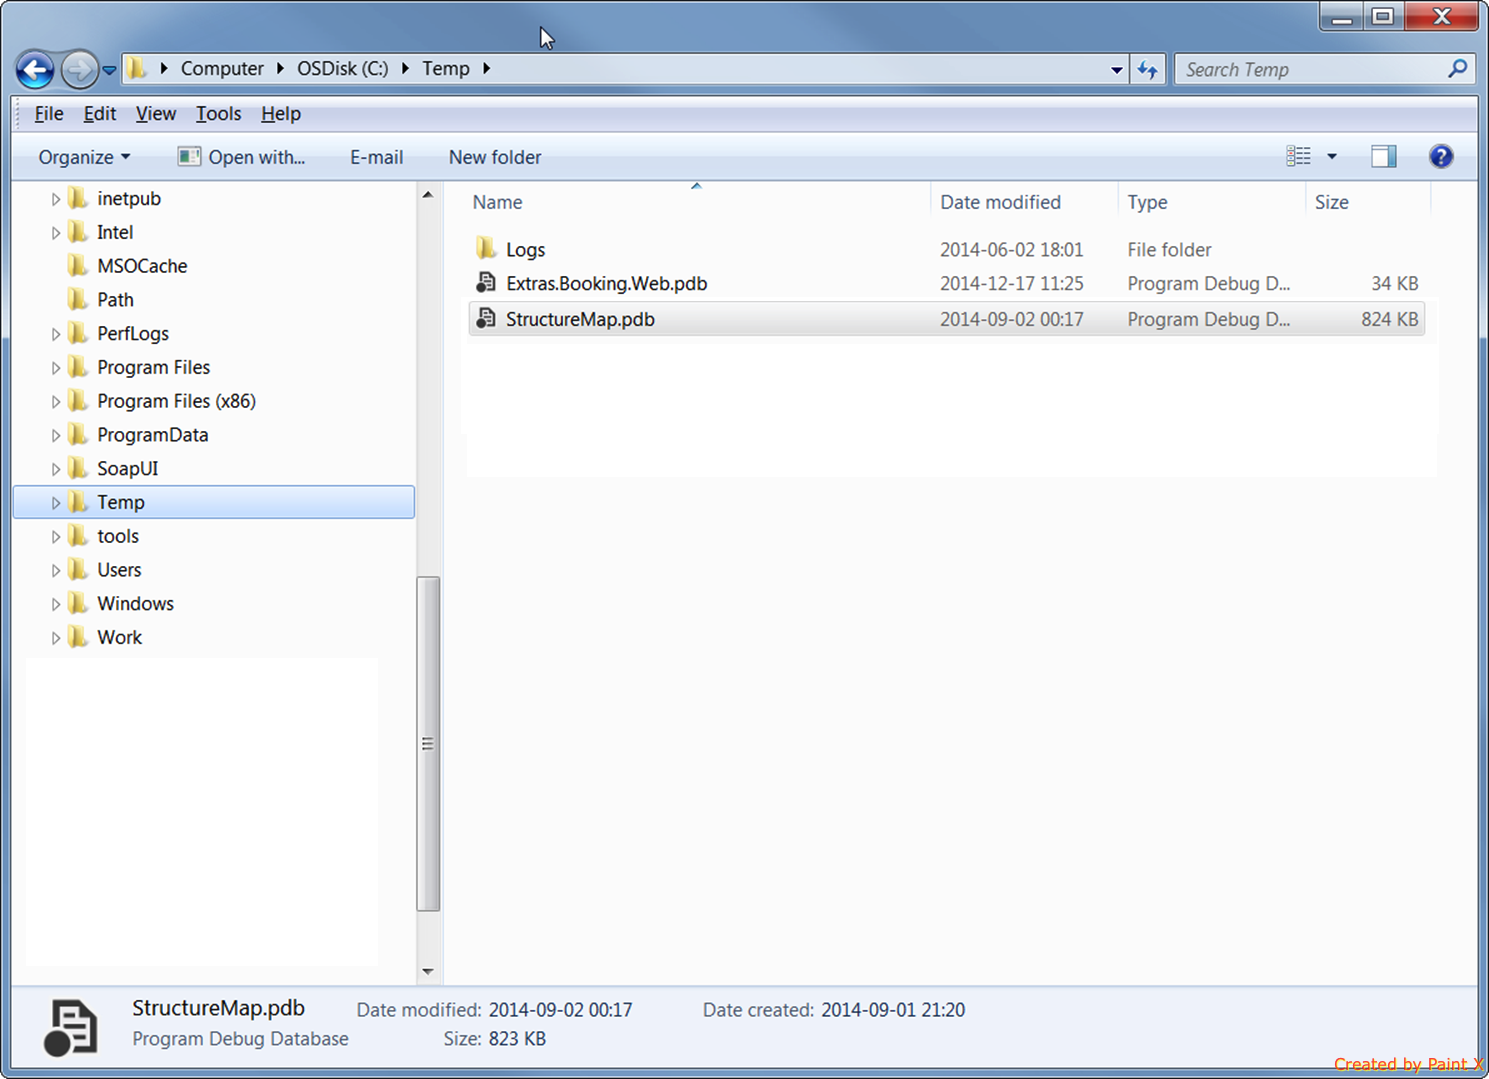
8. We could make this easy or hard, I'm choosing the easy route. Copy the pdb-files from the remote server into a folder on your machine, for example C:\Temp. :)
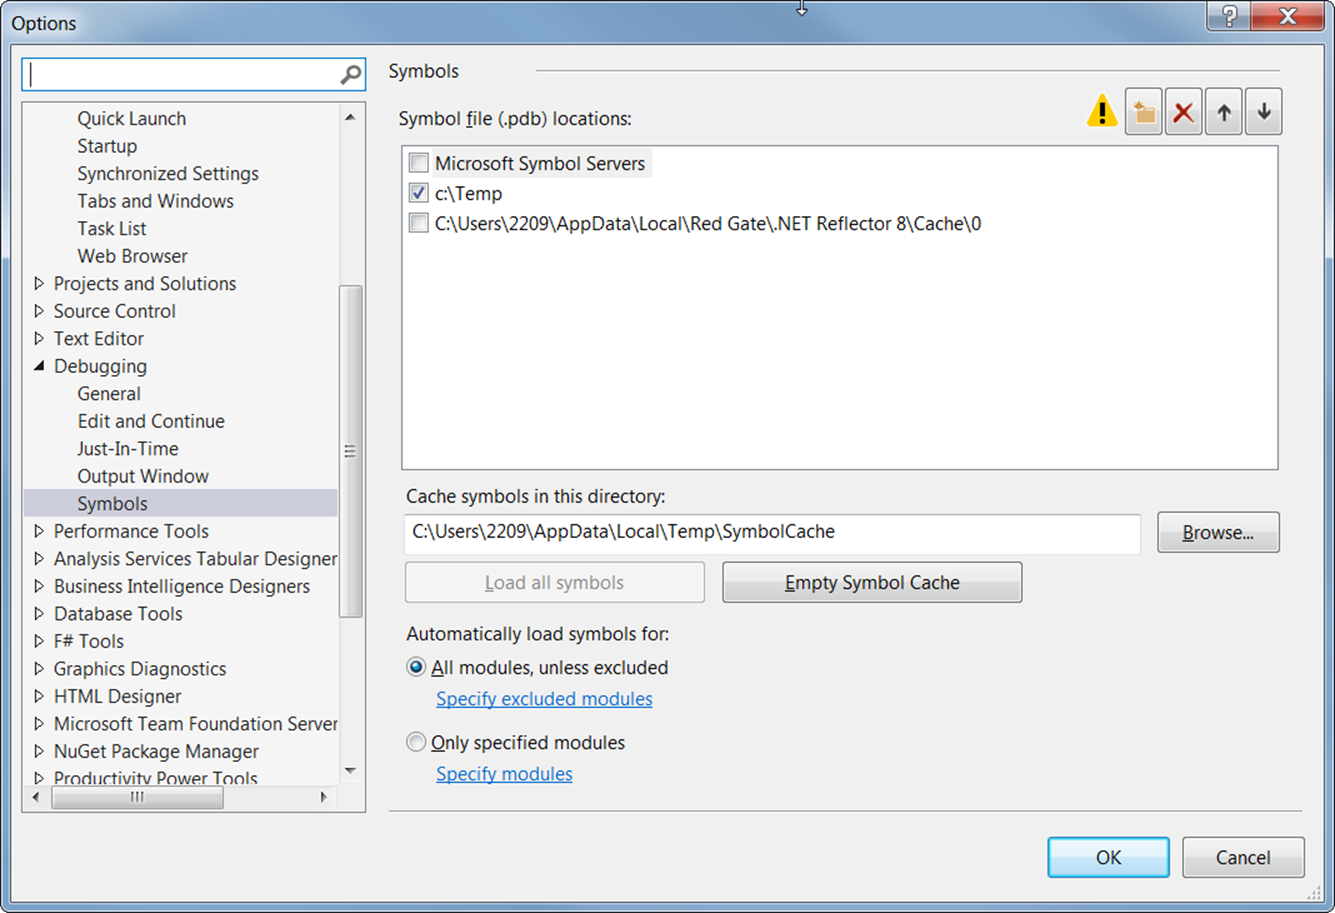
9. Now we have to tell Visual Studio where to look for symbol files. This is done in the almighty Tools >> Options. Click Debugging >> Symbols. Under Symbol File Locations, add the location where you copied the pdb-files, in my case C:\Temp.
10. Reattach to the process, surf onto your erring web or api on the remote server and this time it should work. Breakpoints should be hit, state of variables should be shown. And life is good once again!
Troubleshooting
- Do you have the correct version of the pdb-file? It has to be exactly the same version that is currently running on your remote server. One CI-build later and it's not working.
- Of course, if you install the Remote Debugger on one machine, make sure you're really surfing to that specific machine directly and not through a load balancer.
- If the breakpoint is caught but no state is shown due to "optimizing", it means the build was done with the Release configuration.
- Sometimes you'll get an error message saying "Invalid memory allocation" for a process that's already attached or that you're trying to reattach. It's Visual Studio playing up. Restart it and it will probably work again.
No comments:
Post a Comment