You know when you misspell something in the Command window and have to go all the way back and fix it? Try this instead:
F1: will copy the previous command char by char.
F2: will copy the previous command up to the char you want.
F3: will copy the previous command from the char you are at and to the end.
So, for instance: I wanna run my tests in the console and happen to pick the wrong version of the testrunner, 1.9.2.
>..\src\packages\xunit.runners.1.9.2\tools\xunit.console.exe Car.API.Tests.dll
To change it, I just press F2, copy to the char '2', edit the command with a '3' instead and press F3 to complete the command.
Another gem is the F7-button that will give you the history of commands if you don't wanna page through them with the arrow buttons.
And a very useful one, pipe output to the clipboard. As easy as adding | clip after a command.
>..\xunit.runners.1.9.2\tools\xunit.console.exe Car.API.Tests.dll | clip
Tuesday, 30 December 2014
Monday, 29 December 2014
Time to get a new test project going
I used to have a big solution on one of my PCs at home, containing all the new and exciting stuff I wanted to try out. Opened it up the other week to see if I could make it even bigger but woah, it was infected all over with WCF, Silverlight and good old Comet.
No fun. So this is my new holiday project: A new solution to try out fun stuff. And for sentimental reasons and certain domain knowledge, I'll make it a Car rental solution. :)
I think that's it to begin with... And my intention is to blog about it. If I don't, you know I got stuck in front of Walking Dead again.
No fun. So this is my new holiday project: A new solution to try out fun stuff. And for sentimental reasons and certain domain knowledge, I'll make it a Car rental solution. :)
- I need to work more with Elastic Search, so I'll use that as a repository for one or more of the services. Not because it's a brilliant secure datastore, but to test it out.
- I think I should try out Raven DB as well, it's been a couple of years and I've forgotten all about it.
- I want to get better at thinking DDD style so I'll use it to set up the micro services I want to implement. I'll just use HTTP-requests to call them to begin with, and that will probably make me realise there are some major issues surrounding that and I'll have to solve them. And better here than in a real project at a customer's, right? :)
- I want to use async more, so that will be implemented throughout the system.
- I'm gonna build two clients, one for administering the cars and one for customers renting them. These will probably be built in MVC5, at least one of them, since that is what I'll be working with professionally the coming year.
- I'm gonna try out different ways of logging and getting metrics. This is such a left behind area in developing web solutions and I'm no better. I suck at it, but I do see the huge values.
- I'll try out different ways of deploying. Asimov deploy is on the list. And I wanna look into Docker.
- Since I'm going micro services, I'll do at least one of them in Node.js.
I think that's it to begin with... And my intention is to blog about it. If I don't, you know I got stuck in front of Walking Dead again.
Wednesday, 17 December 2014
Debugging an app on a remote server in your own Visual Studio
I've been there many times. Something is not working on the dev or test environment, logging is below par and I wish I could just debug the application as I do during development on my own machine. And it's actually not very hard to do exactly that.
Prerequisites: The build has to be done with a debug configuration. A release configuration will optimize the pdb-files and you won't be able to follow the state of the code when debugging. In my case, the command that triggers the build script in Jenkins accepts a parameter for which configuration to use. This sets the configuration switch for MS Build to the desired configuration, like so: /p:Configuration={wantedconfiguration}.
So in steps, to get up and running with remote debugging:
1. Log in to the remote server where your app is running.
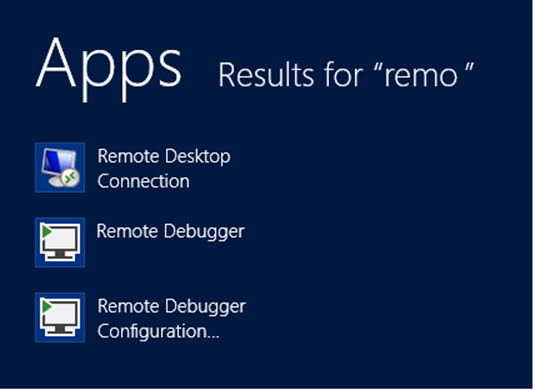
2. Download the correct version of Microsoft's Remote Debugger Tool from here.
3. Install it on the server. To do this, you have to have admin rights on the server since the installer makes the changes needed in the firewall to open the port used by the tool.
4. When the install is done, you'll find two new apps on the server, the Remote Debugger and Remote Debugger Configuration. The Configuration can be changed to run the debugger as a service or to change the settings in the firewall. Usually, the default configuration works just fine.
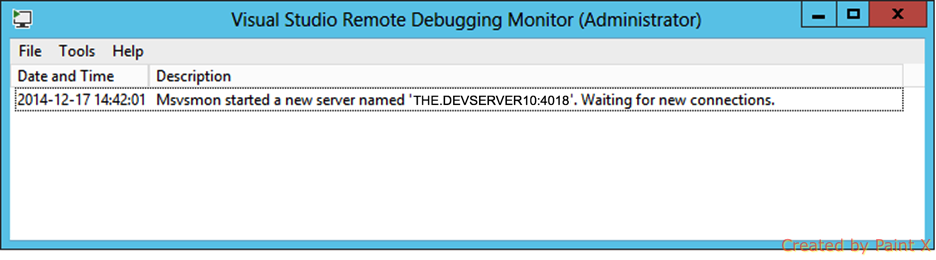
5. Start the Remote Debugger. And, this is important, you have to run it as an administrator. You'll see which URL the debugger is listening at. Copy that URL. You can change settings here too, if you want to allow anonymous access or whatnot, but default settings works fine here as well.
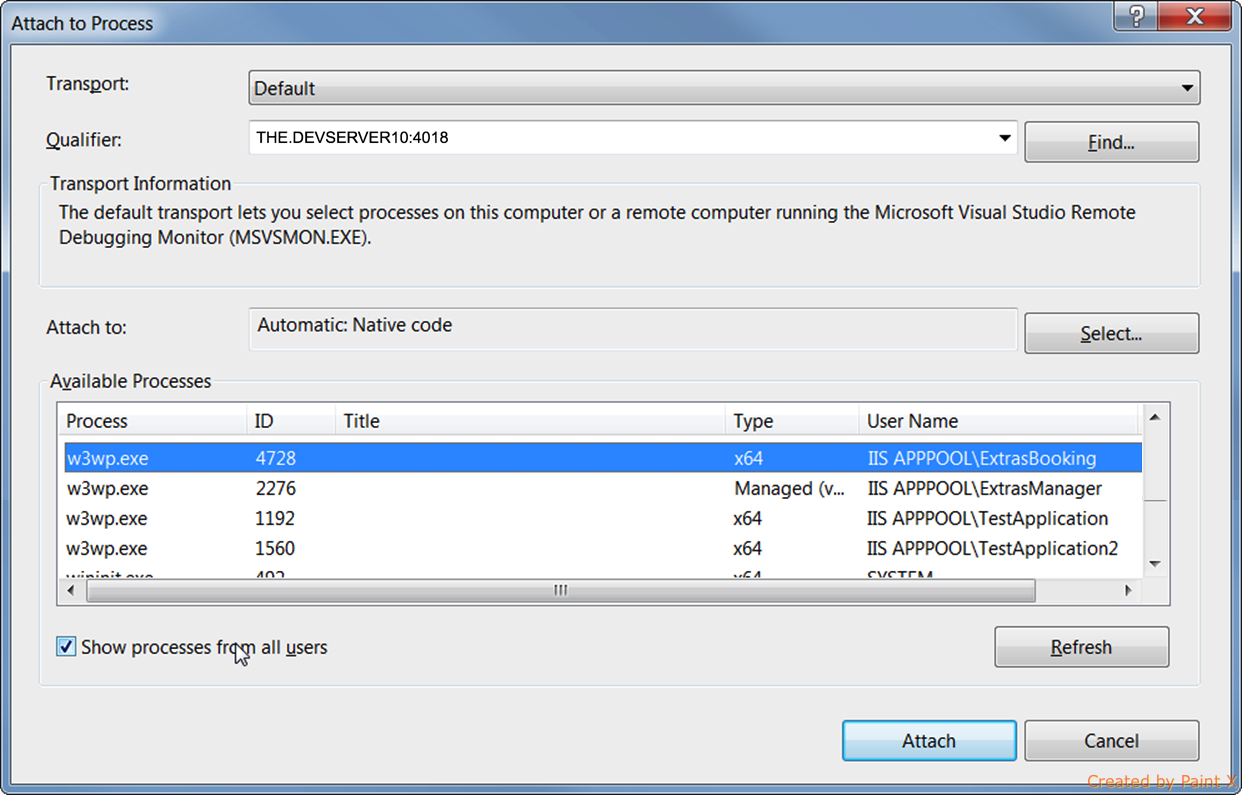
6. Go back to your own local desktop and open the solution you want to debug. In the menu, choose Debug >> Attach to process. In the Qualifier field, paste the URL you copied from the Remote Debugger. This should bring up a list of the processes currently running on that server. Make sure the checkbox 'Show processes for all users' is ticked. Find the process you want to debug and click 'Attach'. IIS sites are running as w3wp.exe processes with the app pool name showing under 'User name'.
7. Now you can set a breakpoint in your code, but you see that it's not active. Mousing over it shows 'No symbols could be loaded'. What is needed are the symbol files, or the pdb files from the remote server. They have to be available locally on the same machine as Visual Studio.
8. We could make this easy or hard, I'm choosing the easy route. Copy the pdb-files from the remote server into a folder on your machine, for example C:\Temp. :)
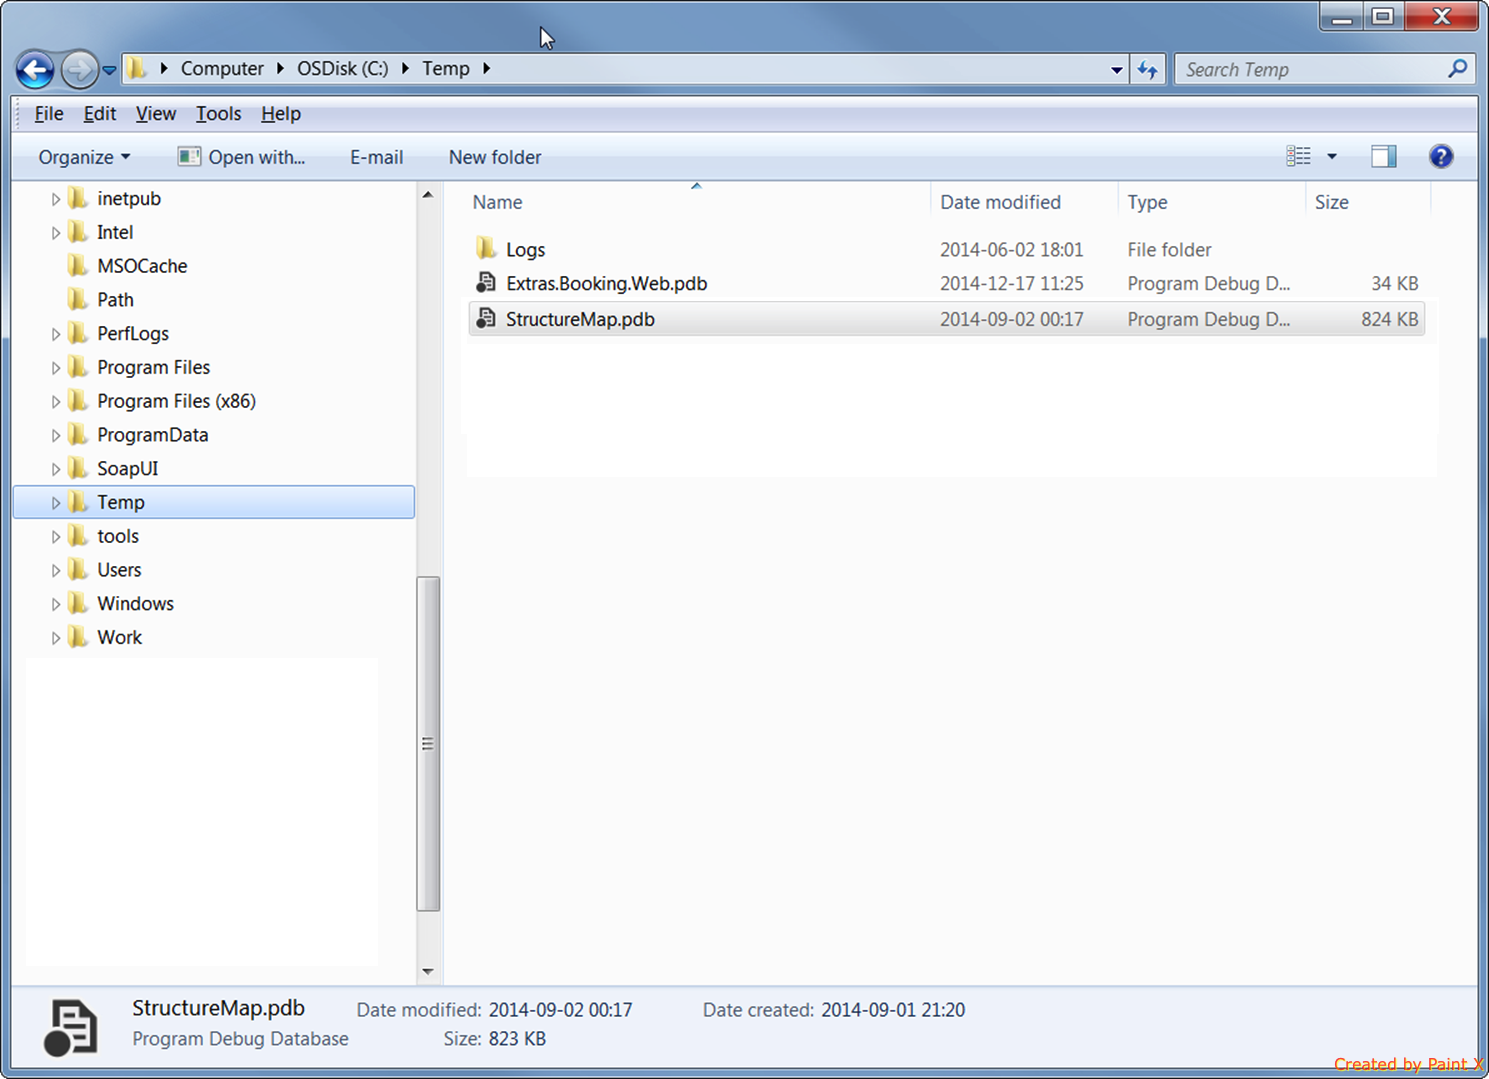
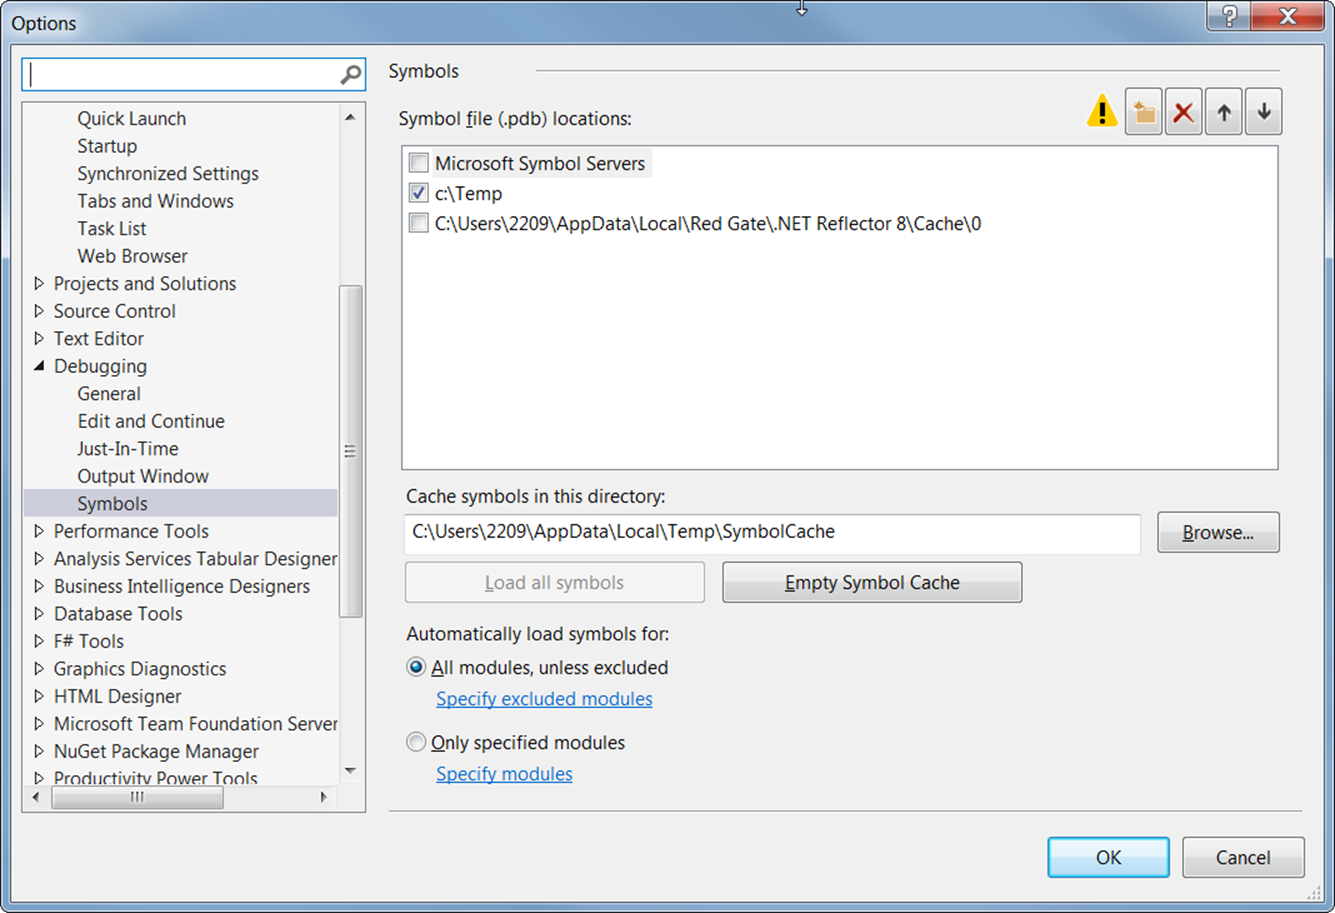
9. Now we have to tell Visual Studio where to look for symbol files. This is done in the almighty Tools >> Options. Click Debugging >> Symbols. Under Symbol File Locations, add the location where you copied the pdb-files, in my case C:\Temp.
10. Reattach to the process, surf onto your erring web or api on the remote server and this time it should work. Breakpoints should be hit, state of variables should be shown. And life is good once again!
Prerequisites: The build has to be done with a debug configuration. A release configuration will optimize the pdb-files and you won't be able to follow the state of the code when debugging. In my case, the command that triggers the build script in Jenkins accepts a parameter for which configuration to use. This sets the configuration switch for MS Build to the desired configuration, like so: /p:Configuration={wantedconfiguration}.
So in steps, to get up and running with remote debugging:
1. Log in to the remote server where your app is running.
2. Download the correct version of Microsoft's Remote Debugger Tool from here.
3. Install it on the server. To do this, you have to have admin rights on the server since the installer makes the changes needed in the firewall to open the port used by the tool.
4. When the install is done, you'll find two new apps on the server, the Remote Debugger and Remote Debugger Configuration. The Configuration can be changed to run the debugger as a service or to change the settings in the firewall. Usually, the default configuration works just fine.
5. Start the Remote Debugger. And, this is important, you have to run it as an administrator. You'll see which URL the debugger is listening at. Copy that URL. You can change settings here too, if you want to allow anonymous access or whatnot, but default settings works fine here as well.
6. Go back to your own local desktop and open the solution you want to debug. In the menu, choose Debug >> Attach to process. In the Qualifier field, paste the URL you copied from the Remote Debugger. This should bring up a list of the processes currently running on that server. Make sure the checkbox 'Show processes for all users' is ticked. Find the process you want to debug and click 'Attach'. IIS sites are running as w3wp.exe processes with the app pool name showing under 'User name'.
7. Now you can set a breakpoint in your code, but you see that it's not active. Mousing over it shows 'No symbols could be loaded'. What is needed are the symbol files, or the pdb files from the remote server. They have to be available locally on the same machine as Visual Studio.
8. We could make this easy or hard, I'm choosing the easy route. Copy the pdb-files from the remote server into a folder on your machine, for example C:\Temp. :)
9. Now we have to tell Visual Studio where to look for symbol files. This is done in the almighty Tools >> Options. Click Debugging >> Symbols. Under Symbol File Locations, add the location where you copied the pdb-files, in my case C:\Temp.
10. Reattach to the process, surf onto your erring web or api on the remote server and this time it should work. Breakpoints should be hit, state of variables should be shown. And life is good once again!
Troubleshooting
- Do you have the correct version of the pdb-file? It has to be exactly the same version that is currently running on your remote server. One CI-build later and it's not working.
- Of course, if you install the Remote Debugger on one machine, make sure you're really surfing to that specific machine directly and not through a load balancer.
- If the breakpoint is caught but no state is shown due to "optimizing", it means the build was done with the Release configuration.
- Sometimes you'll get an error message saying "Invalid memory allocation" for a process that's already attached or that you're trying to reattach. It's Visual Studio playing up. Restart it and it will probably work again.
Alternate solution
If you don't want to install the Remote Debugger Tools on your remote server, you can install it on a fileshare and access it from the remote server.Parallels Desktop, VirtualBox or VMWare?
So, the day finally came when I decided I had to let my pretty pink Zenbook walk into the light. Or rather, permanently into my kids' room and their virus prone Youtubeing. Which meant no more .Net-developing at home. A small setback for a person that basically does .Net for a living, when I don't play around with my brand new MBP toy. So it had to be done: Windows on the Mac. The horror! I know, maybe not nowadays, but in my mind it's a "One does not simply walk into Mordor" type of moment.
Options then. Started out with Virtual Box. Have used it a bit at work to set up a nice virtual local dev environment for a system I worked with briefly. Mind you, I only used it once or twice, before I got tired of it and chose the less time consuming and simpler fashion of just getting the code and fiddle around with the config so everything was local. But anyhow, seemed nice enough. And free.
So off I went, installed Virtual Box and Windows 8.1. All very smooth, but when I start it up I get a resolution of 1024x768. Hey, the nineties! Luckily, there's Google who - yes, it's a who - tells me I have to install Virtual Box Guest Extensions. I'm sure all of this is there in the documentation, but it was TOO LONG so I didn't read it. But, OK, I install the Guest Extensions. Now I get 1440x900. Better, but with a retina screen... Come on! So I Google and find lots of tips I can use with the VBManage command to set the resolution. The screen changes in as many different ways, none of them however good. Blurry, only parts of the screen visible, yada yada.
Finally I add the small word 'retina' to my Google search and immediately get the answer. It's a no go. It just doesn't work. Maybe they'll fix it, but nah.
Uninstalling and moving on to Parallels desktop. Smooth installation, screen resolution works although it's a bit wonky with the size of the icons and texts if you don't change stuff. And wow, it's all shared between my two OS's. And fast. And I can call my Mac Elastic Search from my Windows MVC-app. It's like the dev environment from the future. I'll try it out for 11 more days before I decide if it's worth spending my precious money on. But it looks like a winner.
View in browser directly from Sublime
The tiniest simple thing just made my life a little bit happier. With Package Control installed in Sublime text, choose Install package and look for View in Browser. And voila, pressing Ctrl+Options+C fires up Chrome with my file in it. Lovely.
There's probably tons of great packages out there, though I've only installed Sublime Repl and JS Lint. The latter just made me all downcast for weeks. So many rules, so little patience.
There's probably tons of great packages out there, though I've only installed Sublime Repl and JS Lint. The latter just made me all downcast for weeks. So many rules, so little patience.
Subscribe to:
Posts (Atom)